
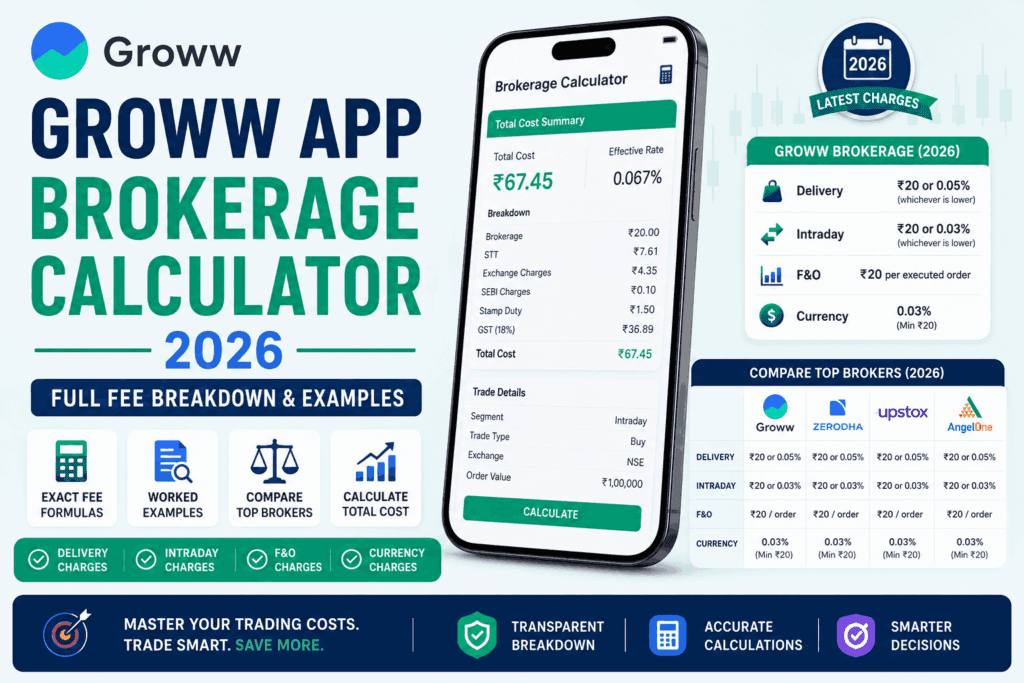
If you have ever placed a trade on Groww and then squinted at the contract note wondering why the total cost looked nothing like “Rs. 20 brokerage,” you are not alone. The brokerage is only one slice of the cost. STT, exchange transaction charges, SEBI turnover fee, IPF, stamp duty, GST and DP charges – all of them stack on top, and most retail investors never see the full picture until they trade live.
This is where the Groww app brokerage calculator earns its place. It takes everything that touches your trade – the segment, the trade value, your state (for stamp duty), buy or sell, the lot size if you’re trading options – and produces the exact total cost before you place the order. Done well, it turns a confusing line of charges into one clean number you can plan around.
This article unpacks the Groww app brokerage calculator end-to-end. We will cover the actual fee structure for 2026, walk through six fully-worked examples across delivery, intraday and options, lay out the math behind every component so you can sanity-check the calculator’s output, and compare your effective Groww cost against Zerodha, Upstox, Angel One and Dhan. By the end, you should be able to predict your trading cost to the rupee, without opening a single calculator app.
Brokerage is a small line on your contract note. The taxes, exchange charges and DP fees are the bigger ones. Knowing the difference is the difference between feeling poorer than expected and actually planning your trading P&L.
What is the Groww app brokerage calculator?
The Groww brokerage calculator is a free, no-signup tool on Groww’s website that computes the total cost of executing a buy and sell trade through Groww. You feed it a few inputs – the trade segment, buy price, sell price, quantity, and your state – and it returns a complete breakdown: brokerage, all statutory charges, DP charges (where applicable), and your net profit or loss after every cost has been accounted for.
The reason this matters: every Indian broker is forced by SEBI to charge the same statutory fees (STT, SEBI turnover, exchange charges, stamp duty, GST), so the only thing that genuinely varies between brokers is their own brokerage. But your effective break-even on a trade is shaped by all charges combined, not just the broker’s piece. A calculator that shows you the full picture lets you trade with a realistic, not naive, view of cost.
How to use the Groww app brokerage calculator: step-by-step
The calculator lives at groww.in/calculators/brokerage-calculator. You do not need a Groww account, you do not need to be logged in, and there is no signup wall. The flow takes under a minute.
Step 1: Choose your trading segment
The calculator offers tabs for Intraday, Delivery, Futures, Options, Currency and Commodity. Pick the one that matches the trade you are planning. Each segment has its own fee structure, so the calculator runs different formulas for each.
Step 2: Enter your buy and sell prices
Type the buy price per share (or premium per unit for options), then the sell price. If you are calculating cost for a one-way trade only – say, just a buy – enter the same number in both fields and ignore the sell-side STT, which the calculator will not apply.
Step 3: Enter the quantity (or lot size)
For equity, enter the number of shares. For options and futures, enter the number of lots multiplied by the lot size (e.g. for 1 lot of Nifty CE at lot size 75, enter 75).
Step 4: Select your state (for stamp duty)
Stamp duty is charged at the state level, but since June 2020, the rate has been unified across India – 0.015% on delivery buys, 0.003% on intraday and F&O buys. The state dropdown is mainly retained for completeness; the rate does not vary anymore.
Step 5: Read the output
The calculator returns a line-by-line breakdown: brokerage, STT, exchange transaction charges, SEBI fee, GST, stamp duty and (for delivery sells) DP charges. It tells you the total cost, your break-even price, and the net profit or loss given your chosen buy and sell prices.
If you only want to know one number before placing a trade, look at the break-even price. That is the sell price at which you neither gain nor lose money – a brutally honest reality check on whether the trade is worth taking.
Groww Brokerage Calculator
Calculate charges, taxes & net P&L before you trade
Groww’s 2026 fee structure: what the calculator is actually computing
Below is the full Groww fee schedule for 2026, verified against Groww’s own pricing and help-centre pages. Once you understand the rules, the calculator stops being a black box.
Brokerage rules by segment
| Segment | Brokerage Rule | Effective on a Rs. 1 lakh Trade |
|---|---|---|
| Equity Delivery | Lower of Rs. 20 or 0.1% of trade value (min Rs. 5) | Rs. 20 (0.1% = Rs. 100, so capped at Rs. 20) |
| Equity Intraday | Lower of Rs. 20 or 0.1% of trade value (min Rs. 5) | Rs. 20 per leg |
| Equity Futures | Flat Rs. 20 per executed order | Rs. 20 regardless of turnover |
| Equity Options | Flat Rs. 20 per executed order | Rs. 20 regardless of lot size |
| Currency Futures | Flat Rs. 20 per executed order | Rs. 20 |
| Currency Options | Flat Rs. 20 per executed order | Rs. 20 |
| Commodity | Flat Rs. 20 per executed order | Rs. 20 |
| Mutual Funds (Direct) | Rs. 0 – genuinely zero commission | Rs. 0 |
The most common confusion here is the “lower of Rs. 20 or 0.1%” rule. Below a trade value of Rs. 20,000, the 0.1% slice is less than Rs. 20, so you pay 0.1%. Above Rs. 20,000, you pay the Rs. 20 flat cap. And below a trade value of Rs. 5,000, the minimum brokerage of Rs. 5 kicks in. Knowing the break-points helps:
- Trade < Rs. 5,000: Minimum brokerage of Rs. 5 applies.
- Trade Rs. 5,000 – Rs. 20,000: 0.1% applies (i.e. Rs. 5 to Rs. 20).
- Trade > Rs. 20,000: Flat Rs. 20 cap applies.
Statutory and exchange charges (apply to every Indian broker, not just Groww)
These are not Groww-specific. SEBI mandates that every broker pass through the same statutory and exchange charges – they cannot be “discounted” by any broker. The numbers below are the 2026 rates.
| Charge | Equity Delivery | Equity Intraday | Equity F&O |
|---|---|---|---|
| STT | 0.1% on buy + sell | 0.025% on sell side | 0.02% sell (futures), 0.10% sell premium (options) |
| Exchange Transaction (NSE) | 0.00297% | 0.00297% | Futures: 0.00173%; Options: 0.03503% |
| Exchange Transaction (BSE) | 0.00375% | 0.00375% | Futures: 0.00173%; Options: 0.03503% |
| SEBI Turnover Fee | 0.0001% | 0.0001% | 0.0001% |
| Investor Protection Fund | 0.0001% (NSE) | 0.0001% (NSE) | 0.0001% (NSE) |
| Stamp Duty | 0.015% on buy | 0.003% on buy | Futures: 0.002%; Options: 0.003% on buy |
| GST | 18% on brokerage + exchange + SEBI + DP | 18% on brokerage + exchange + SEBI | 18% on brokerage + exchange + SEBI |
| DP Charges | Rs. 20 (M) / Rs. 19.75 (F) + GST per sell | Not applicable | Not applicable |
Even if a broker advertises “zero brokerage,” your contract note will still show STT, exchange charges, stamp duty, GST and DP charges. These are statutory, not negotiable.
The math behind the Groww brokerage calculator
If you want to verify the calculator’s output yourself – or build a quick personal version in Excel – here are the formulas it runs in the background.
Formula: Equity Delivery (per leg)
Turnover = Price x Quantity Brokerage = MIN(Rs. 20, 0.1% x Turnover) but not less than Rs. 5 STT = 0.1% x Turnover (applied on BOTH buy and sell) Exchange Charges = 0.00297% x Turnover (NSE) SEBI Fee = 0.0001% x Turnover IPF Charge = 0.0001% x Turnover (NSE only) Stamp Duty = 0.015% x Turnover (buy side only) GST = 18% x (Brokerage + Exchange Charges + SEBI Fee + IPF + DP) DP Charges = Rs. 20 (or Rs. 19.75 for female investors) + 18% GST (sell side only)
Formula: Equity Intraday (per leg)
Turnover = Price x Quantity Brokerage = MIN(Rs. 20, 0.1% x Turnover) but not less than Rs. 5 STT = 0.025% x Turnover (SELL SIDE ONLY) Exchange Charges = 0.00297% x Turnover SEBI Fee = 0.0001% x Turnover IPF Charge = 0.0001% x Turnover Stamp Duty = 0.003% x Turnover (buy side only) GST = 18% x (Brokerage + Exchange Charges + SEBI Fee + IPF)
Formula: Equity Futures (per leg)
Turnover = Price x Lot Size x Number of Lots Brokerage = Rs. 20 (flat) STT = 0.02% x Turnover (sell side only) Exchange Charges = 0.00173% x Turnover SEBI Fee = 0.0001% x Turnover IPF Charge = 0.0001% x Turnover Stamp Duty = 0.002% x Turnover (buy side only) GST = 18% x (Brokerage + Exchange Charges + SEBI Fee + IPF)
Formula: Equity Options (per leg)
Premium Turnover = Premium x Lot Size x Number of Lots Brokerage = Rs. 20 (flat) STT = 0.10% x Premium Turnover (sell side only, on premium) Exchange Charges = 0.03503% x Premium Turnover SEBI Fee = 0.0001% x Premium Turnover IPF Charge = 0.0001% x Premium Turnover Stamp Duty = 0.003% x Premium Turnover (buy side only) GST = 18% x (Brokerage + Exchange Charges + SEBI Fee + IPF)
STT on options is calculated on the premium value, not on the contract value. This is the single most-misunderstood rule in Indian options taxation. Get this wrong and you will materially miscalculate your cost on every options trade.
Six worked examples: see the Groww calculator in action
Theory only goes so far. Below are six realistic trades, calculated cell-by-cell, that show you exactly what the calculator returns.
Example 1: Equity delivery – buy Rs. 1,00,000, sell Rs. 1,10,000
You buy 1,000 shares of an ABC stock at Rs. 100, hold for two months, and sell at Rs. 110. Trade value on the buy leg is Rs. 1,00,000; on the sell leg, Rs. 1,10,000. Here is what the Groww brokerage calculator will show:
| Component | Buy Side (Rs. 1,00,000) | Sell Side (Rs. 1,10,000) |
|---|---|---|
| Brokerage | Rs. 20 (capped) | Rs. 20 (capped) |
| STT | Rs. 100 (0.1%) | Rs. 110 (0.1%) |
| Exchange Transaction (NSE 0.00297%) | Rs. 2.97 | Rs. 3.27 |
| SEBI Turnover (0.0001%) | Rs. 0.10 | Rs. 0.11 |
| IPF Charge (0.0001%) | Rs. 0.10 | Rs. 0.11 |
| Stamp Duty (0.015% on buy) | Rs. 15 | Rs. 0 |
| DP Charges (sell only, Rs. 20 + 18% GST) | Rs. 0 | Rs. 23.60 |
| GST 18% on brokerage + exchange + SEBI + IPF | Rs. 4.16 | Rs. 4.22 |
| Total per Leg | Rs. 142.33 | Rs. 161.31 |
| Round-trip total cost | Rs. 303.64 | |
| Cost as % of trade value | 0.30% |
Notice that on a 10% gross profit (Rs. 10,000), the total cost stack is Rs. 303.64 – about 3% of your gross profit. The single biggest line is STT (Rs. 210 across both legs), not brokerage. This is the cost reality of a delivery trade.
Example 2: Equity intraday – buy at Rs. 1,00,000, sell at Rs. 1,00,500
You buy 200 shares of XYZ at Rs. 500 in the morning and square off at Rs. 502.50 by 3 PM. Both legs in the same trading day – that is intraday. Notice how dramatically lower the cost is than delivery, because there is no DP charge and intraday STT is only 0.025% on the sell side.
| Component | Buy Leg (Rs. 1,00,000) | Sell Leg (Rs. 1,00,500) |
|---|---|---|
| Brokerage | Rs. 20 | Rs. 20 |
| STT (0.025% on sell only) | Rs. 0 | Rs. 25.13 |
| Exchange Transaction (NSE 0.00297%) | Rs. 2.97 | Rs. 2.98 |
| SEBI Turnover (0.0001%) | Rs. 0.10 | Rs. 0.10 |
| IPF Charge (0.0001%) | Rs. 0.10 | Rs. 0.10 |
| Stamp Duty (0.003% on buy) | Rs. 3.00 | Rs. 0 |
| GST 18% on brokerage + exchange + SEBI + IPF | Rs. 4.16 | Rs. 4.16 |
| Total per Leg | Rs. 30.33 | Rs. 52.47 |
| Round-trip total cost | Rs. 82.80 | |
| Cost as % of turnover | 0.041% |
Round-trip cost on a Rs. 1 lakh intraday trade is Rs. 82.80 – roughly 0.041% of turnover. That is the structural reason intraday traders can afford to take smaller-percentage moves than delivery investors: the cost-per-trade is dramatically lower.
Example 3: Nifty options scalp – buy 1 lot CE at 150, sell at 170
You buy 1 lot of a Nifty 25000 Call Option at a premium of Rs. 150, with a lot size of 75. The option moves to Rs. 170 and you square off. Notice that you make Rs. 20 per share x 75 = Rs. 1,500 gross profit on a Rs. 11,250 premium investment – but you also pay options-specific charges.
| Component | Calculation |
|---|---|
| Trade | Buy 1 lot Nifty 25000 CE at Rs. 150; sell at Rs. 170 (lot size 75) |
| Turnover (buy) | Rs. 150 x 75 = Rs. 11,250 |
| Turnover (sell) | Rs. 170 x 75 = Rs. 12,750 |
| Brokerage | Rs. 20 + Rs. 20 = Rs. 40 (flat per leg) |
| STT on sell premium (0.10%) | Rs. 12.75 |
| Exchange Transaction (0.03503% on premium turnover) | Rs. 8.40 |
| SEBI Turnover (0.0001%) | Rs. 0.02 |
| IPF (0.0001%) | Rs. 0.02 |
| Stamp Duty (0.003% on buy) | Rs. 0.34 |
| GST 18% on brokerage + exchange + SEBI + IPF | Rs. 8.72 |
| Total all charges | Rs. 70.25 |
| Net P&L = Gross profit (Rs. 1,500) minus charges (Rs. 70.25) | Rs. 1,429.75 |
Total charges: Rs. 70.25 – roughly 5% of your gross profit. The big-ticket items here are the exchange transaction charge (0.03503% of premium turnover is higher than equity rates) and STT on sell premium (0.10%, applied only when you sell).
Example 4: Small delivery trade – Rs. 4,000 buy and sell
You buy a couple of shares of a Rs. 1,000-priced stock – total trade value Rs. 4,000. Here, the Rs. 20 brokerage cap does not apply because 0.1% of Rs. 4,000 is Rs. 4, which falls below the Rs. 5 minimum. So:
- Brokerage per leg: Rs. 5 (minimum applies because 0.1% = Rs. 4 < Rs. 5)
- STT (buy + sell): Rs. 4 + Rs. 4 = Rs. 8
- Exchange + SEBI + IPF: Approx. Rs. 0.30 across both legs
- Stamp duty (buy only): Rs. 0.60
- DP charges (sell only): Rs. 20 + Rs. 3.60 GST = Rs. 23.60
- GST on brokerage + exchange + SEBI + IPF: Approx. Rs. 1.85
- Total round-trip cost: Approximately Rs. 49
That Rs. 49 on a Rs. 4,000 trade is 1.23% of your trade value. Lesson: small-ticket delivery trades are disproportionately expensive on a percentage basis because of the flat DP charges. If you trade small, batch your sells to amortise the DP charge across larger positions.
Example 5: Equity futures – 1 lot Bank Nifty at Rs. 50,000 entry, Rs. 50,200 exit
Lot size 15, entry Rs. 50,000, exit Rs. 50,200. Buy turnover Rs. 7,50,000; sell turnover Rs. 7,53,000.
- Brokerage (2 legs flat): Rs. 40
- STT on sell (0.02%): Rs. 150.60
- Exchange (0.00173% x both legs): Approx. Rs. 26
- Stamp duty (0.002% on buy): Rs. 15
- GST 18% on brokerage + exchange + SEBI + IPF: Approx. Rs. 12
- Total cost: Approximately Rs. 245 on a gross profit of Rs. 3,000 (Rs. 200 x 15)
Example 6: Mutual fund SIP – Rs. 5,000 monthly
Last example, the simplest one: you start a Rs. 5,000 monthly SIP into a direct equity mutual fund through Groww. The cost calculation is – wait for it – exactly Rs. 0. Groww does not charge any commission on direct mutual funds. The only cost you bear is the fund’s own expense ratio, which is built into the NAV and applies regardless of which app you use.
This is why direct-only mutual fund apps (Groww, Coin, Kuvera, Paytm Money) save you so much over 20 years compared to apps that sell regular plans with embedded distributor commissions.
Groww vs other brokers: who is actually cheapest?
The Rs. 20 flat brokerage is now standard across most major Indian discount brokers, but the structural details differ in ways that matter. Here is how Groww stacks up against the other major apps in 2026:
| Broker | Delivery | Intraday | F&O | Demat AMC |
|---|---|---|---|---|
| Groww | Lower of Rs. 20 / 0.1% | Lower of Rs. 20 / 0.1% | Rs. 20 flat | Rs. 0 lifetime |
| Zerodha | Free | Lower of Rs. 20 / 0.03% | Rs. 20 flat | Rs. 300/yr |
| Upstox | Free | Lower of Rs. 20 / 0.05% | Rs. 20 flat | Rs. 150-300 |
| Angel One | Free | Lower of Rs. 20 / 0.25% | Rs. 20 flat | Rs. 0 (1st yr) |
| Dhan | Free | Lower of Rs. 20 / 0.03% | Rs. 20 flat | Rs. 0 |
| ICICI Direct | 0.55% slab | 0.275% slab | Slab-based | Rs. 700+ |
Two observations from this table:
On delivery, Groww is not the cheapest
Zerodha, Upstox, Angel One and Dhan all offer free equity delivery. Groww still charges Rs. 20 (or 0.1%, whichever is lower). On a Rs. 1 lakh delivery trade, that is Rs. 20 you pay on Groww that you would not pay elsewhere. Over a year of regular delivery investing, this can add up.
On AMC, Groww is unbeatable
Groww’s zero-lifetime-AMC is the cleanest in Indian broking. Zerodha charges Rs. 300/year. ICICI Direct charges Rs. 700+. Over 10 years of a long-term portfolio, Groww saves you Rs. 3,000-7,000 in AMC alone – more than enough to offset the delivery brokerage difference for casual investors.
The honest math: if you place fewer than 50 delivery trades a year, Groww’s zero AMC is the better deal. If you place 100+ delivery trades a year, Zerodha or Dhan’s free delivery wins on cumulative cost.
Pros and cons of the Groww brokerage calculator
Pros
- Free, no login required – genuinely public utility
- Covers all major segments (delivery, intraday, F&O, currency, commodity, IPO)
- Returns line-by-line cost breakdown, not just a total
- Calculates break-even price – the most useful output for active traders
- Includes state-level stamp duty (mostly redundant now, but accurate)
- Updated rates aligned to 2026 SEBI and exchange schedules
Cons
- Calculator does not save your inputs – you must re-enter for each scenario
- No multi-scenario comparison side-by-side
- Does not let you compare Groww’s charges against competitor brokers
- Currency and commodity tabs are less polished than the equity ones
- Mobile interface is functional but cramped on smaller screens
- No CSV / Excel export of results – copy-paste only
Practical use cases for the Groww brokerage calculator
1. Pre-trade cost check
Before placing a high-frequency trade (intraday or options), run the calculator with your planned price and quantity. It will show you the exact cost and the price at which you break even – critical information when you’re sizing a trade against your max-loss tolerance.
2. Comparing across segments
If you’re deciding whether to take a position via delivery vs intraday vs F&O on the same underlying, the calculator helps you see the cost difference. A delivery position attracts STT on both sides at 0.1% – significantly higher than intraday’s 0.025% on the sell side only – which can change the trade’s structure.
3. Position sizing for break-even
If you want a particular percentage P&L outcome, work backward through the calculator: enter the buy price, then experiment with sell prices until you see the desired profit after charges. That gives you the actual target price you need to hit.
4. Tax planning at year-end
If you are looking to harvest long-term capital gains within the Rs. 1.25 lakh exemption, the calculator helps you decide between selling a small position now vs a larger one later, given the DP and exchange charges involved.
5. Comparing brokers
Run the same trade through the Groww calculator and a competitor’s calculator (Zerodha’s brokerage calculator is the most widely used alternative). The brokerage line will differ; the STT and exchange-charge lines will be identical. This isolates the broker’s real cost advantage, separate from the statutory pass-throughs.
Common mistakes when interpreting the Groww calculator output
1. Treating brokerage as the total cost
Rs. 20 brokerage is a small fraction of your total cost on most trades. STT, exchange charges, GST and stamp duty often add up to more than brokerage itself. Always look at the total, not just the broker’s line.
2. Forgetting DP charges on every delivery sell
DP charges of approximately Rs. 23.60 (including GST) apply every time you sell shares from your demat account – regardless of trade value. If you make many small sales, these compound quickly. Batch your sells when possible.
3. Ignoring the minimum brokerage on tiny trades
On a Rs. 1,000 trade, you do not pay Rs. 1 (which would be 0.1%). You pay Rs. 5 – the minimum. This makes very small trades disproportionately expensive.
4. Confusing turnover with profit
Turnover (used to calculate STT and exchange charges) is the full value of your trade, not the gain. A Rs. 10 lakh delivery trade that nets Rs. 5,000 profit still attracts STT and charges on the full Rs. 10 lakh – not on the Rs. 5,000 profit.
5. Assuming options STT works like equity STT
Options STT is calculated on the premium turnover, not the strike-price-based notional value. This is dramatically lower in nominal terms but at 0.10%, the rate is much higher than the 0.025% intraday rate.
6. Overlooking GST on charges other than brokerage
GST at 18% applies to brokerage, exchange charges, SEBI fee, IPF and DP charges – but not to STT or stamp duty. The calculator handles this correctly, but if you build your own version, do not double-tax.
Frequently Asked Questions
Q1. Is the Groww app brokerage calculator free?
Yes. The calculator is freely available at groww.in/calculators/brokerage-calculator, without login or signup. Groww does not charge anything for using it and there are no hidden costs – it is purely a utility tool meant to inform investors before they trade.
Q2. Does the Groww calculator include all charges including STT and GST?
Yes. The Groww brokerage calculator displays brokerage, STT, exchange transaction charges, SEBI turnover fee, IPF, stamp duty, GST and DP charges (where applicable) for every trade. You can verify the math against Groww’s own pricing page if you want to double-check.
Q3. How accurate is the Groww brokerage calculator for 2026?
The Groww calculator is updated to current statutory rates – including the Budget 2024 STT changes on F&O – and reflects Groww’s own pricing as of May 2026. That said, government rates can change in any Union Budget, so always verify against the latest schedule for high-value or complex trades.
Q4. What is the Groww brokerage on a Rs. 50,000 delivery trade?
On a Rs. 50,000 delivery trade, Groww’s brokerage is Rs. 20 (because 0.1% would be Rs. 50, and the lower-of-Rs. 20-or-0.1% rule caps it at Rs. 20). Total cost including STT (Rs. 50), stamp duty (Rs. 7.50), exchange charges (Rs. 1.49), SEBI fee, IPF, GST and DP charge on sell, will be approximately Rs. 150 round-trip.
Q5. Does the Groww brokerage calculator include DP charges?
Yes, for equity delivery sells. DP charges of Rs. 20 + 18% GST (for male investors) or Rs. 19.75 + GST (for female investors) are applied when you sell shares from your demat account. Intraday and F&O trades do not attract DP charges because they are not delivery-settled.
Q6. Why is the brokerage on my Rs. 4,000 trade Rs. 5 instead of Rs. 4?
Groww has a minimum brokerage of Rs. 5 per executed order. On any equity trade where 0.1% of the trade value works out to less than Rs. 5, you pay the Rs. 5 minimum. This kicks in at trade values below Rs. 5,000.
Q7. Can the Groww calculator compare costs with Zerodha or Upstox?
No, the Groww calculator only calculates Groww’s charges. To compare, you would need to run the same trade through Zerodha’s brokerage calculator (zerodha.com/brokerage-calculator) or Upstox’s calculator separately. Statutory charges (STT, exchange, GST, stamp duty) will be identical across all brokers – only the brokerage line will differ.
Q8. Does the Groww brokerage calculator work for mutual fund investments?
Mutual fund direct plans on Groww have zero commission and zero transaction fees, so there is nothing for the calculator to compute. The Groww calculator is built for equity, F&O, currency and commodity trades – not mutual funds.
Q9. What is the difference between intraday and delivery charges on Groww?
Brokerage rules are identical (Rs. 20 or 0.1%, whichever lower). The main differences are: (a) STT – delivery is 0.1% on both legs, intraday is 0.025% on the sell side only; (b) Stamp duty – delivery is 0.015% on buy, intraday is 0.003% on buy; (c) DP charges – delivery sells attract DP charges, intraday does not. Net result: a same-value intraday trade costs roughly one-third of a delivery round-trip.
Q10. Is the Groww brokerage calculator different from Groww’s commission disclosure?
No – they describe the same fee structure, but from different angles. Groww’s commission disclosure on the help page tells you the rules (Rs. 20 or 0.1%, lower); the calculator applies those rules to a specific trade with specific quantities and shows you the actual rupee cost.
Final verdict: how to get real value from the Groww brokerage calculator
The Groww app brokerage calculator does one thing well: it tells you, before you trade, exactly what your trade will cost. That sounds basic, but most retail investors discover the full cost stack only after they have placed a trade, and that is usually too late to back out.
Three habits will get you the most out of it:
- Run it before every non-trivial trade. Especially on small-ticket delivery trades where DP charges and the minimum-brokerage rule disproportionately matter. The 30 seconds it takes can save you from a trade that loses money to charges alone.
- Focus on the break-even price. Not the brokerage, not the total cost – the break-even sell price. That is the single most useful number for sizing your target and stop-loss against.
- Cross-check against a competitor. Once a month, run the same trade through Zerodha’s or Upstox’s calculator. The difference in brokerage (Rs. 20 vs Rs. 0 on delivery, for instance) is the real broker-cost picture. The statutory charges are not something any broker can change.
Bottom line: the brokerage calculator is not a finance product. It is a planning tool. Use it the same way you would check a map before a drive – briefly, before you start, to know what is ahead.
Brokerage is the price you pay the broker. Total cost is the price you pay to participate in the market. A good brokerage calculator turns the latter into a number you can plan around – and that is what makes it valuable.
